一、矩阵
1、定义和简单使用(一般的编程语言,数组下标都是从0开始的,但是MATLAB是从1开始的)
>> a=[1 4 7;
2 5 8;
3 6 9]

a =

     1     4     7
     2     5     8
     3     6     9

>> b=[2 3 4;3 4 5;4 5 3];
>> c=[1;2;3];
>> a+b

ans =

     3     7    11
     5     9    13
     7    11    12

>> a*b

ans =

    42    54    45
    51    66    57
    60    78    69

>> a*c

ans =

    30
    36
    42
2、常用矩阵运算和函数
A':矩阵转置;
A+B,A-B,A*b:矩阵加减;
inv(A):矩阵求逆;
rank(A):矩阵的秩;
B/A:等价于B*inv(a);
A.*B:点乘,即对应元素相乘;
A(i,:),A(:,j):第i行,第j列;
zeros(n):n阶零矩阵;
eye(n):单位矩阵;
[X,D]=eig(A):X,特征向量,D,特征值
A([i,j],:)=A([j,i],:0):第i行和第j行交换位置;
二、极限(limit),求导(diff),积分(int)
>> F=sym('(1+a/x)^x');
>> limit(F,'x',inf,'left')

ans =

exp(a)

>> syms x;
>> y=log((x+2)/(1-x));

>> diff(y,x)

ans =

((1/(x - 1) - (x + 2)/(x - 1)^2)*(x - 1))/(x + 2)

>> diff(y,x,3)

ans =

(2*(1/(x - 1) - (x + 2)/(x - 1)^2)*(x - 1))/(x + 2)^3 - (2*(2/(x - 1)^2 - (2*(x + 2))/(x - 1)^3))/(x + 2) - (2*(1/(x - 1) - (x + 2)/(x - 1)^2))/(x + 2)^2 + (2*(2/(x - 1)^2 - (2*(x + 2))/(x - 1)^3)*(x - 1))/(x + 2)^2 + ((6/(x - 1)^3 - (6*(x + 2))/(x - 1)^4)*(x - 1))/(x + 2)

>> y=x^5+y^3-sqrt(x)/4;
>> int(y)
Warning: Explicit integral could not be found.

ans =

int(log(-(x + 2)/(x - 1))^3, x) - x^(3/2)/6 + x^6/6

>> pretty(ans)

                            3
                            -
    /                       2    6
   |     /   x + 2 3      x    x
   |  log| - ----- |  dx - -- + --
  /         x - 1 /       6    6
三、绘图
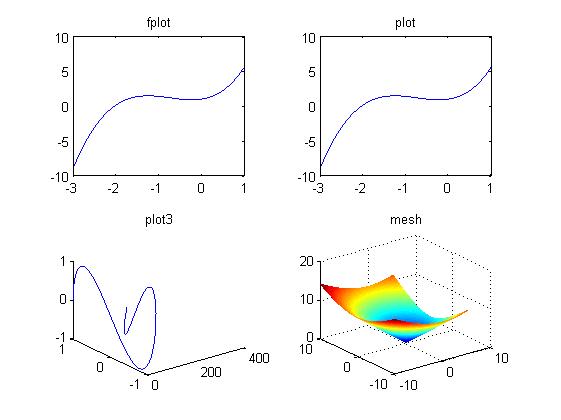
常用的绘图函数有fplot,plot,plot3,mesh,还有一个辅助函数meshgrid。fplot是根据一个已知的函数表达式画图,plot是画一个二维图,已知x,y的坐标,plot3是画三维图,mesh是画有颜色的三维网状(将空间中每三个点连成一个三角片)图。
fplot('x^3+2*x^2+exp(x)',[-3,1]);
subplot(2,2,1);
fplot('x^3+2*x^2+exp(x)',[-3,1]);
title('fplot');
x=-3:0.1:1;
y=x.^3+2*x.^2+exp(x);
subplot(2,2,2);
plot(x,y);
title('plot');
t=0:0.1:6;
x=t.^3;
y=cos(t);
z=sin(2*t);
subplot(2,2,3);
plot3(x,y,z);
title('plot3');
subplot(2,2,4);
x=-10:0.1:5;
y=-10:0.1:10;
[x,y]=meshgrid(x,y);
z=sqrt(x.^2+y.^2);
mesh(x,y,z);
title('mesh');
运行(F5)结果如图所示: